A few weeks ago I finally wrapped up my first semester research project with a presentation to the Plasma Research Lab faculty, which went surprisingly well. Now with yet another fusion related project or two lined up for this semester which has just started, I felt that it’s worth taking a moment to reflect on my first real university research project;
“Computer Modelling of Coherence Imaging with Stark and Doppler Broadening for Hydrogen Plasma Electron Density and Temperature Diagnostics”
…phew! I’m out of breath just saying that in my head! This is the problem when you avoid using over-used words like “novel” and “innovative”…
Anyway, what was my project on? I’ll assume you know what nuclear fusion is (if not, check out my blog on it here). So, if you have a fusion reactor in which you’re magnetically confining plasma and heating it up to several hundred million degrees Celsius, you’re probably going to want to know what’s happening inside. In fact, it’s crucial for fusion research, since understanding plasma parameters such as temperature, density and flow (how particles are moving around) allows for greater understanding of turbulence. Turbulence in plasmas is much the same as in air flows, and just like how turbulence makes your airplane flight shaky, so too does turbulence destabilize plasmas. This has the problem of reducing how much power you can get out in a future power plant, and even resulting in damage to the reactor vessel.
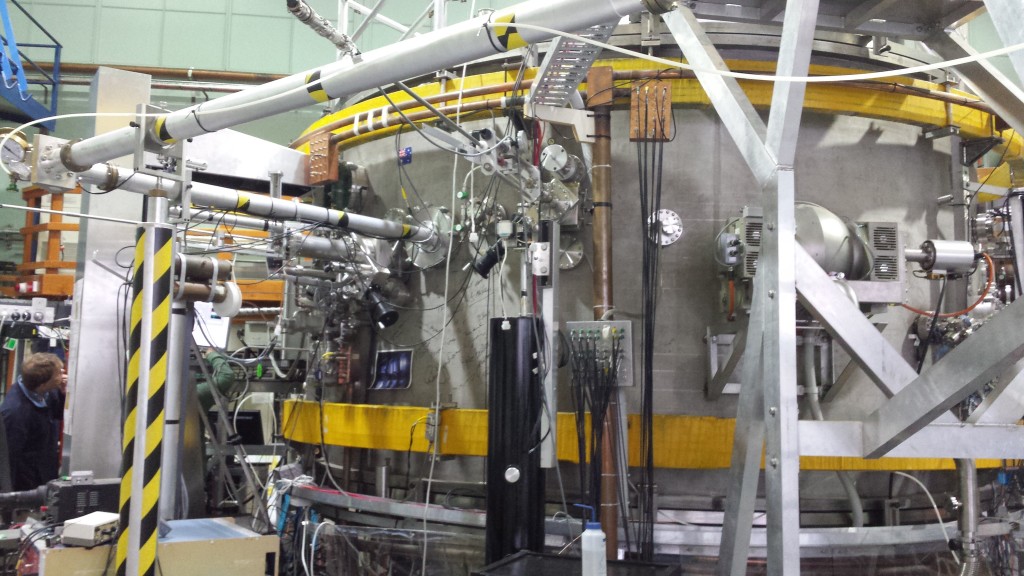
Since plasma is so damn hot though, you can’t just stick a thermometer in and see what the temperature is. Although there are probes which can actually physically be placed inside the plasma (or at least around the edges), problems arise with these; since sticking a physical measurement device into a confined plasma may interrupt and cause instabilities, and they often only provide local restricted measurements. Other methods include shooting particles into the plasma and seeing what happens, however these are expensive, tricky to setup and often very low resolution. So we need diagnostic techniques to get this important information (density and temperature) by somehow externally, passively observing the plasma.
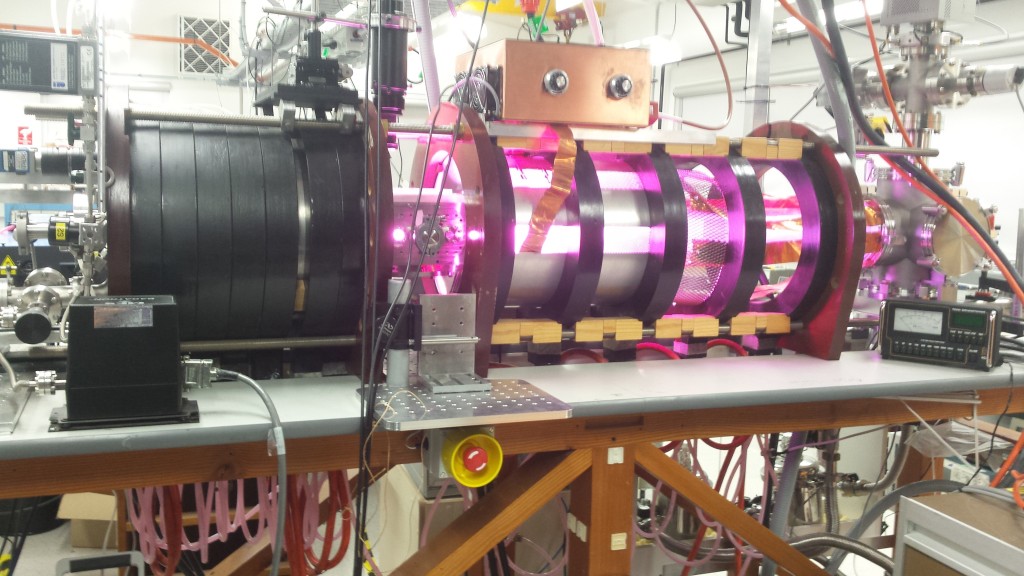
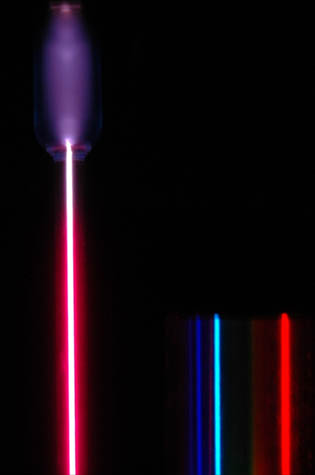
Spectroscopy measurements provide a means of doing this by looking at the light given off by atom, which occurs when electrons drop to lower energy levels. Electrons can only occupy discrete energy levels, that is it could be in n = 2 or n = 3, but not in between for example. You can visualize these as spherical shells coming out from the atom with higher levels corresponding to higher energy states. When an electron drops from a higher to a lower shell it emits a photon – a packet of light – with the energy difference of the two shells. These electronic transitions give rise to spectral (light) emissions with particular frequencies and wavelengths, and is actually what gives the universe its colour. My project looked experimentally and theoretically at the hydrogen gamma transition (n = 5 -> 2), which is part of the Balmer series. This is kinda poetic in a sense, since hydrogen is the most common element in the universe and the primary component of stars which undergo nuclear fusion. The visible light and its colour is given by the Balmer series; H-gamma at 434.1nm wavelength is violet, whereas H-alpha (n = 3 -> 2) at the slightly longer 656.3nm is red. These are the paints which make up the stars, gas clouds and nova that we observe on the universal canvas in the night sky. It just so happens that they also provide a means to diagnose our own little mini-stars on Earth.
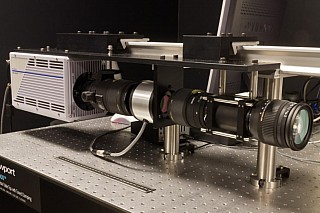
When you look at these transitions on a spectrum, they appear as very fine sharp lines at different wavelengths and frequencies. If you zoom in very closely, you can see that they are in fact a curved lineshape. The fact that they’re not perfectly straight lines is rather odd however, since we just said electrons can only do very definite transitions which correspond to exact wavelengths, but you can detect H-gamma light a little to the left and a little to the right of 434.1nm. There is some instrumental error here, sure, but there is also some rather subtle physics at work – spectral broadening effects – phenomena which turn out to be key to this whole diagnostic technique.
My project looked particularly at Doppler and Stark broadening; which relate to temperature and electron density respectively.
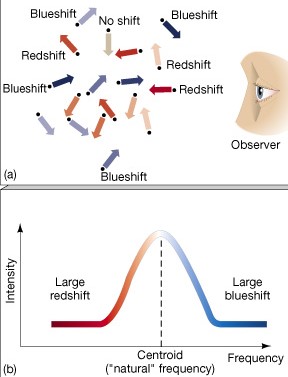
You’ve probably heard of the Doppler effect before – that high and low pitched shift in sound when a car passes you by is a classic example. The same occurs with light too, except instead of passing cars its particles. Temperature is actually a measure of the “average kinetic energy” of particles, so higher temperatures mean faster particles moving away or towards you – and thus larger shifts in the frequencies and wavelengths of observed light. This results in spectral lines from hot objects – like plasmas – being broadened. We measure the broadening of the lineshape by looking at the “Full Width Half Maximum” (FWHM), and with some equations and fancy maths, relate this directly to the temperature of the emitting object!
(Feel free to message or email me if you’re curious about the fancy maths – Fourier transforms and tomographical inversions galore!)
Okay, but what about electron density? In plasmas, electrons are totally free to move about and are an essential component to understand, and we can measure the density of electrons in a plasma by observing the Stark effect. This one is a bit more complicated, and arises from electric fields interacting with atoms and messing around with those energy levels I mentioned earlier. The Stark effect describes how electric fields actually split this levels into a multiplet, which you can see in the diagram below.
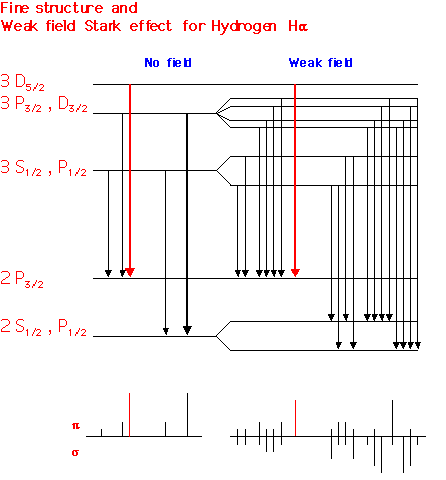
Because there’s all these extra possible energy levels now, so atomic transitions like H-gamma have a bunch of slightly different paths to choose from which all correspond to shifted frequencies and wavelengths. Thus, the Stark effect also results in a broadened spectral line. In a plasma, this is provided by a randomly generated electric field by electrons. A higher density of electrons means a stronger electric field, stronger Stark effect and thus wider broadening, so measuring the FWHM of such a line also gives us electron density!
Of course, I’m leaving out the complicated-ish maths and computer modelling side of the project; which is what actually took up most of my time…but that’s the gist of it. It turns out that this does actually work, and we currently have some preliminary data from MAGPIE (MAGnetized linear plasma interaction device at ANU), which I’ll hopefully be working with this semester. My next project will in fact be looking at more physical phenomenon within plasma created in MAGPIE; including particle ionization balance and cross field flows. I won’t actually pretend to know what I’ll be doing this semester since I still have no idea…but that’s half the fun!
-A
Leave a Reply